Key points
A graph is drawn on a pair of Two reference lines, one horizontal and one vertical, that cross at right-angles. They are used to define the position of a point on a grid. Axes is the plural of axis. . The 𝒙-The line on a graph that runs horizontally (left-right) through the origin. It is used as a reference to measure from. is horizontal and the 𝒚-The line on a graph that runs vertically (up-down) through the origin. It is used as a reference to measure from. is vertical. The point at which the axes meet is called the The position (0, 0) where 𝒙 = 0 and 𝒚 = 0.
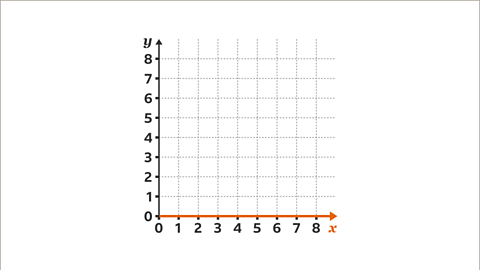
Axes are labelled with numbers, in equal steps, which are placed in line with the gridlines. The The regular intervals of how values increase on each axis. on the axes do not need to be the same.
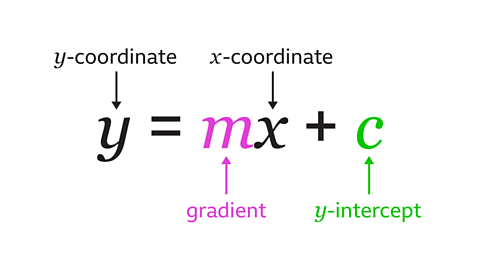
Ordered pairs called The ordered pair of numbers (𝒙, 𝒚) that defines the position of a point. are used to fix a position on a graph. A point is plotted using coordinates in the form (𝒙, 𝒚).
The 𝒙 value gives the The right-left direction on a graph or map. Parallel to the horizon. movement from the origin along the 𝒙-axis and the 𝒚 value gives the The up-down direction on a graph or map. movement from the origin along the 𝒚-axis.
Understanding axes
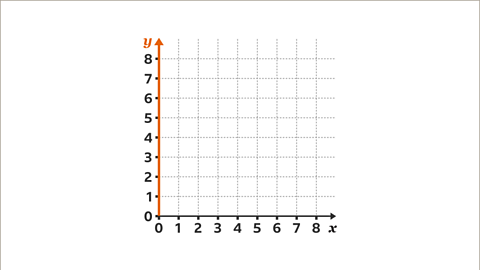
For a simple graph, the The region of a graph that uses positive values for both 𝒙 and 𝒚. The first quadrant is the upper-right of the four quadrants. is used. A graph has two axes that form an L-shape. The axes are labelled 𝒙 and 𝒚.
The 𝒙-axis is the horizontal line and the 𝒚-axis is the vertical line.
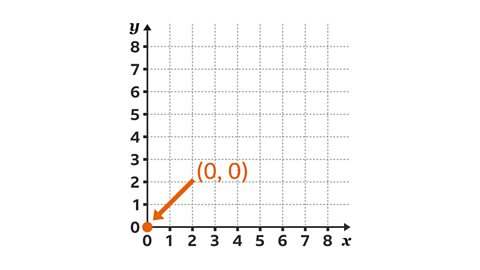
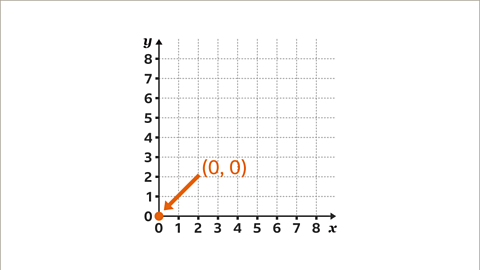
The origin is the position where 𝒙 = 0 and 𝒚 = 0. The origin has coordinates (0, 0).
To draw axes for a given set of coordinates:
The axes will include all given coordinate values of 𝒙 and 𝒚.
The scales used depends on the values of 𝒙 and 𝒚, and on the available grid.
- If possible, use a scale counting in ones.
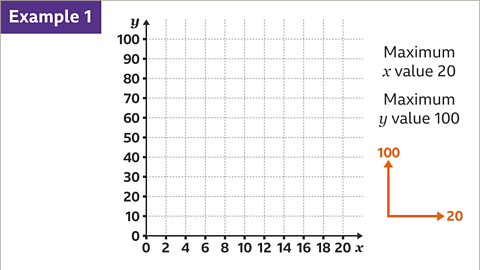
- For larger values, use larger steps. Eg, count in 2, 4, 5, 10, 20, 50, 100
- For smaller values, use smaller steps. Eg, count in 0۰1, 0۰2, 0۰5
- Avoid steps counting in numbers which are difficult to subdivide, such as 3, 6 or 7
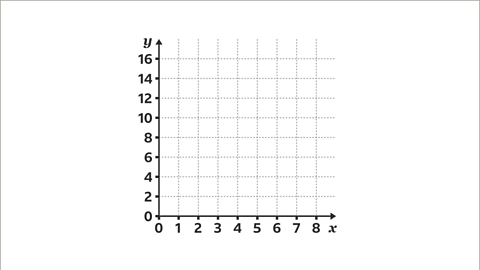
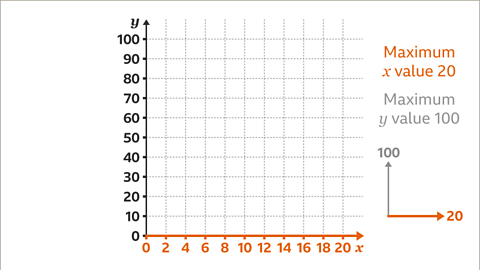
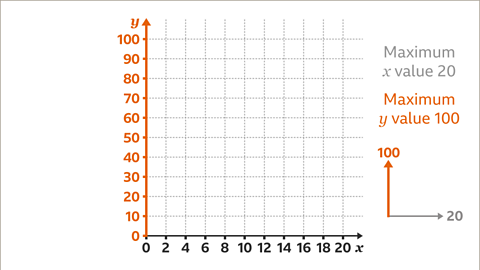
Remember that the scales on each axis do not have to be the same. The 𝒙-axis could be labelled in steps of 5 and the 𝒚-axis in steps of 20
Examples
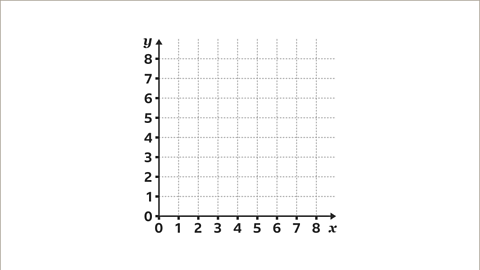
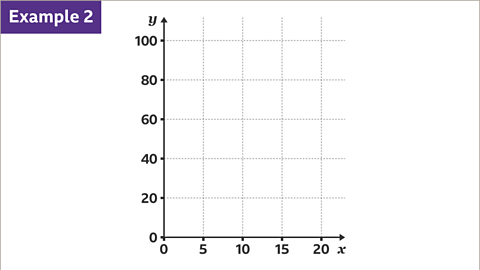
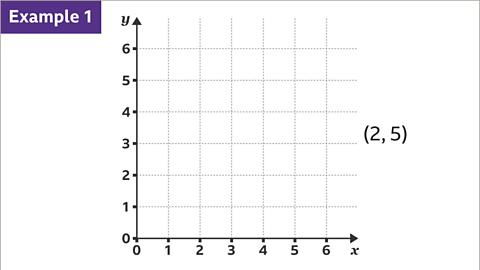
Image caption, A pair of axes, labelled 𝒙 and 𝒚.
1 of 9
Question
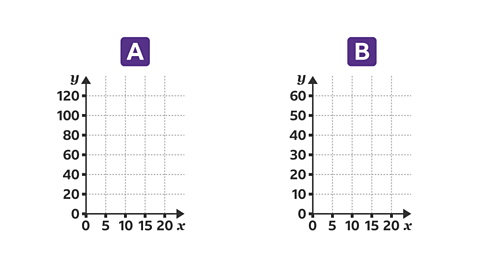
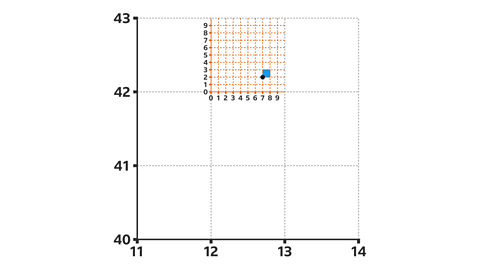
Decide which grid, A or B, is most suitable for plotting points where the maximum coordinate for 𝒙 is 17 and the maximum coordinate for 𝒚 is 59
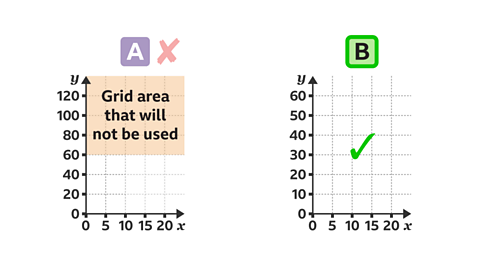
Both the grids can be used to plot a maximum of 17 for 𝒙 and a maximum of 59 for 𝒚.
However, the axes in A would have a lot of wasted space.
The axes in B are more suitable as they allow for the largest and smallest 𝒙 and 𝒚 values to be plotted without any wasted space.
Understanding and plotting coordinates in the first quadrant
The The region of a graph that uses positive values for both 𝒙 and 𝒚. The first quadrant is the upper-right of the four quadrants. uses positive values for the 𝒙-axis and the 𝒚-axis. The axes form an L -shape.
Coordinates are ordered pairs of 𝒙 and 𝒚.
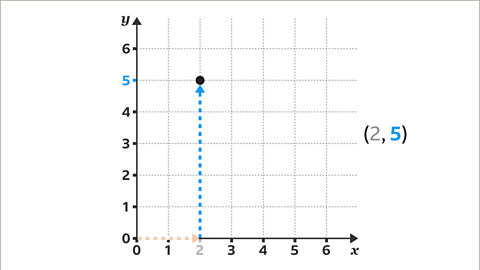
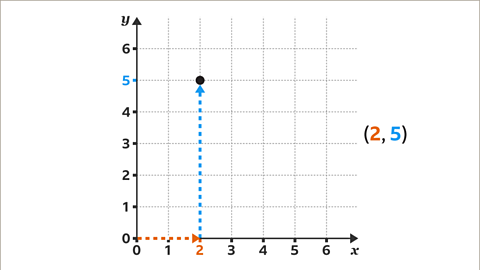
- The An agreed way of writing mathematical ideas. Eg, coordinates are written as (𝒙, 𝒚). (𝒙, 𝒚) gives a position on a coordinate grid.
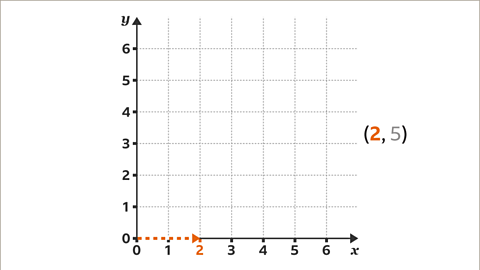
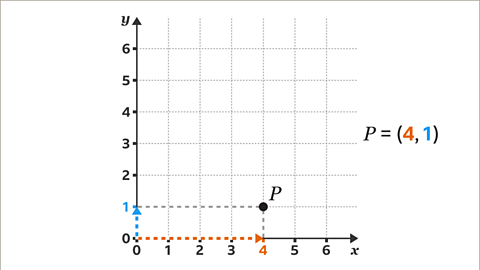
- The first coordinate value represents 𝒙. This is a horizontal movement to the right from the origin.
- The second coordinate value represents 𝒚. This is a vertical movement up from the origin.
- The combined movements of 𝒙 and 𝒚 give the position of the plotted point.
Examples
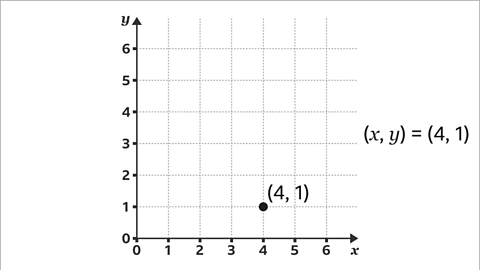
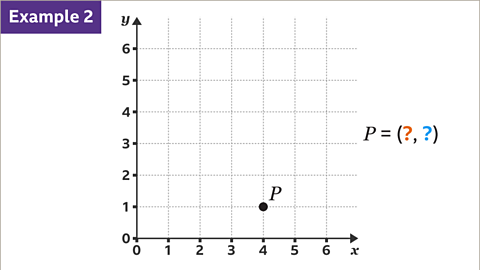
Image caption, Coordinates are an ordered pair of 𝒙 and 𝒚 which give a position on a grid.
1 of 7
Question
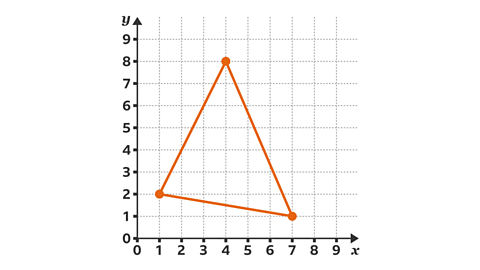
List the coordinates that create the triangle drawn on the grid.
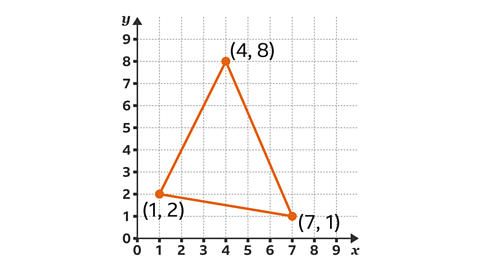
The triangle is drawn by joining the points which are positioned at coordinates (1, 2), (7, 1) and (4, 8).
Practise axes and coordinates
Quiz
Practise reading axes and plotting coordinates with this quiz. You may need a pen and paper to help you with your answers.
Real-life maths
Understanding coordinates is useful for map reading.
The location of a position on an Ordnance Survey (OS) map is managed by using a six-figure grid reference.
This works by first identifying an area using a four-figure grid reference. The square is then subdivided into a 10 by 10 grid for more precise detail.
Understanding grid references is useful when learning OS map skills.
Play Sudoku with BBC Bitesize!
Every weekday we release brand new easy, medium and hard Sudoku puzzles. Perfect for testing your skill with numbers and logic.

More on Graphs
Find out more by working through a topic
- count2 of 7
- count3 of 7
- count4 of 7