Introduction to data
This page has been put together to help you practise and revisit some of the brilliant skills you’ve learned all through primary school.
It’s a great way to boost your confidence in Maths and get you ready for the exciting next step into Year 8!
Let's become data detectives! Handling data is a 4-step process that helps us understand the world around us.
In this guide, you will learn:
- the 4 steps: collect, organise, show, analyse
- how to organise data in a table before you draw a chart
- how to calculate the mean, mode, median and range
- how to spot trends, make predictions and find errors in real-life data
The four steps of handling data
Handling data is a process. To get the right answer, you must follow the steps in the correct order.
Step 1: collect - This is where you gather your information (eg survey 10 friends' test scores or favourite pets).
Step 2: organise - This is the most important step! Before you draw anything, you must organise your results, usually in a tally chart or a frequency table.
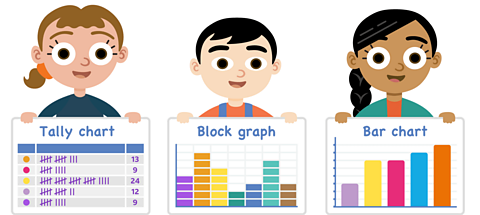
Step 3: show - Now you can display your organised data in a chart.
This could be a:
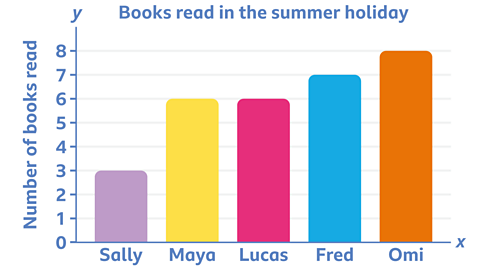
- bar chart (good for comparing amounts, like house points)
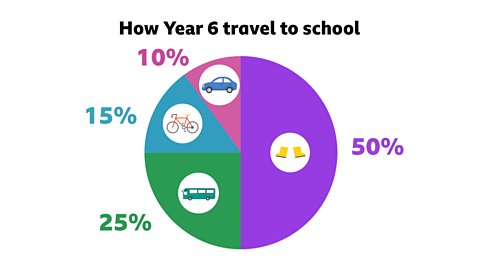
- pie chart (good for showing percentages, like votes)
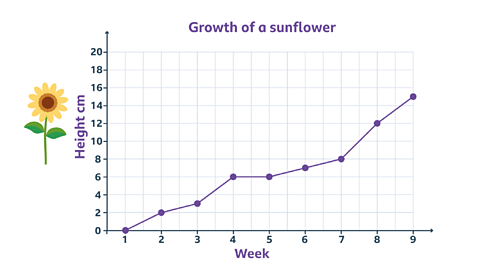
- line graph (good for showing changes over time, like temperature)
Step 4: analyse - This is where you find out what the data tells you.
You ask questions like:
- "What was the most popular?" (This is the mode)
- "What was the average score?" (This is the mean)
- "What is the spread of the data?" (This is the range)
The four ways to analyse data
Analyse (step 4) is where you use your maths skills. The four key methods are mean, mode, median and range.
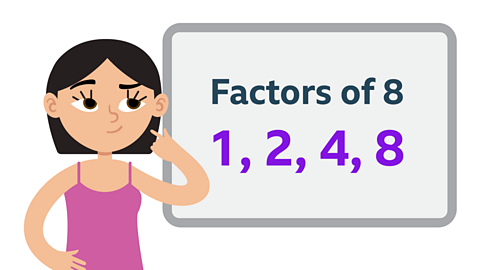
1. The mode: This is the most common or most popular value.
In the list 5, 7, 7, 8, 9, the mode is 7.
This is great for shops wanting to know the 'most popular' shoe size to order.
2. The median: This is the middle number, but only after you have put all the numbers in order from smallest to largest.
In the list 5, 7, 8, 9, 10, the median is 8.
(If you have two middle numbers, find the number halfway between them).
3. The mean: This is what people usually mean by 'the average'.
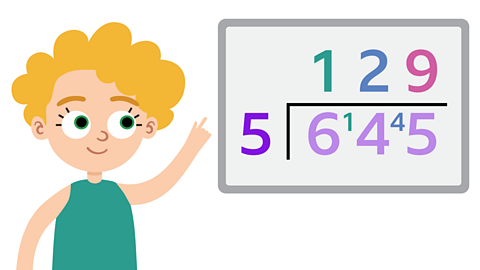
How to find it: add up all the numbers, then divide by how many numbers there are.
Example: for 5, 7, 8
Add: 5 + 7 + 8 = 20
Divide: there are 3 numbers, so 20 ÷ 3 = 6.66…
The mean is 6.66…
4. The range: This isn't an average. It measures the spread of the data.
How to find it: Take the highest value and subtract the lowest value.
In the list 5, 7, 7, 8, 9, the range is 9 - 5 = 4.
The 4-step challenge
Summary

You are now a data expert!
You know the four vital steps: collect, organise (in a table), show (in a chart), and analyse.
You can also find the mean, mode, median and range for any set of data, and you know how to spot trends and errors.
Brain boost
Think about these questions to stretch your thinking and sharpen your skills!
What's the difference between the mean and the median? Which one is the 'middle' number?
A shop wants to order more trainers. Should they find the mean, mode, or median shoe size sold last month? (Hint: They want the most popular size).
If you have the list of numbers 10, 2, 8, what is the first thing you must do before you can find the median?
Have a chat about your answers with a parent, teacher or your class.
More on Practise and revise KS2 maths
Find out more by working through a topic
- count1 of 24
- count2 of 24
- count3 of 24
- count4 of 24