Venn diagrams
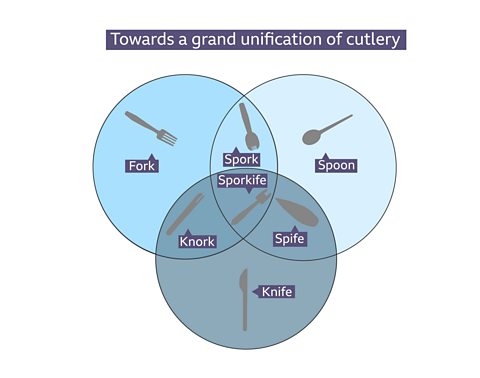
A Venn diagram shows the relationship, in a visual way, between groups of different things.
They are used in many areas of life to classify items as well as highlighting similarities and differences.
Venn diagrams with 2 circles are shown in Module 1 (M1) Venn diagrams
Venn diagrams can have three circles:
Example
Venn diagram showing the pizza toppings chosen by a group of friends.
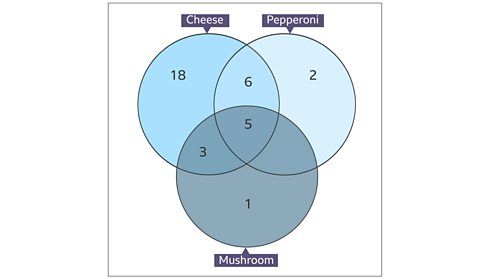
How many chose cheese?
How many chose pepperoni and cheese?
How many chose cheese but not mushroom?

18 + 6 + 5 + 3 = 32
32 choose cheese.

6 + 5 = 11
11 choose pepperoni and cheese.

18 + 6 = 24
24 choose cheese but not mushroom.
Question
There are 150 pupils in Year 11 sitting some, if not all, of the following examinations: English, Maths and Science.
- 15 pupils are sitting both English and Maths but not Science
- 20 pupils are sitting Science and Maths but not English
- 18 pupils are sitting Science and English but not Maths
- 8 pupils are sitting all three exams
- 65 are sitting Science in total
- 55 are sitting English in total
- 72 are sitting Maths in total
How many pupils do not sit any of these examinations?
Draw a Venn diagram to help you answer this question.
Start by filling in as much information as possible on the Venn diagram:
You can see each circle only has one section missing. Since we know the total number that took each subject, we can work out those missing sections.
Science
- 20 + 18 + 8 = 46
- 65 are sitting Science altogether
- 65 – 46 = 19
- 19 pupils are sitting Science only
Maths
- 20 + 15 + 8 = 43
- 72 are sitting Maths
- 72 – 43 = 29
- 29 pupils sitting Maths only
English
- 18 + 15 + 8 = 41
- 55 of the pupils are sitting English
- 55 – 41 = 14
- 14 pupils are sitting English only
We can now fill in this information on our diagram.
Let’s add the values we have so far:
14 + 15 + 18 + 19 + 20 + 8 + 29 = 123
Now subtract this from the total number of pupils in Year 11:
150 – 123 = 27
So we know 123 pupils will sit exams and since there are 150 pupils in the year group, there must be 27 pupils who do not sit any of these examinations.
Test yourself
More on M2: Handling data
Find out more by working through a topic